Dryer temperature, dew point, airflow and schedule affect both energy and material quality.
Plastics packaging integrated-energy audit example
Molding machines, resin drying, process cooling and compressed air diagnosed as one packaging energy system.
This case starts from the production line: resin handling and drying, injection/extrusion/blow molding, mold cooling, compressed air, drives, conveyors and electrical demand.
- Separates machine load, drying heat, process cooling, compressed air and demand charge.
- Reports quality constraints for resin drying and mold/tool cooling.
- Controls double counting between fan/pump heat, cooling load and recovered heat.
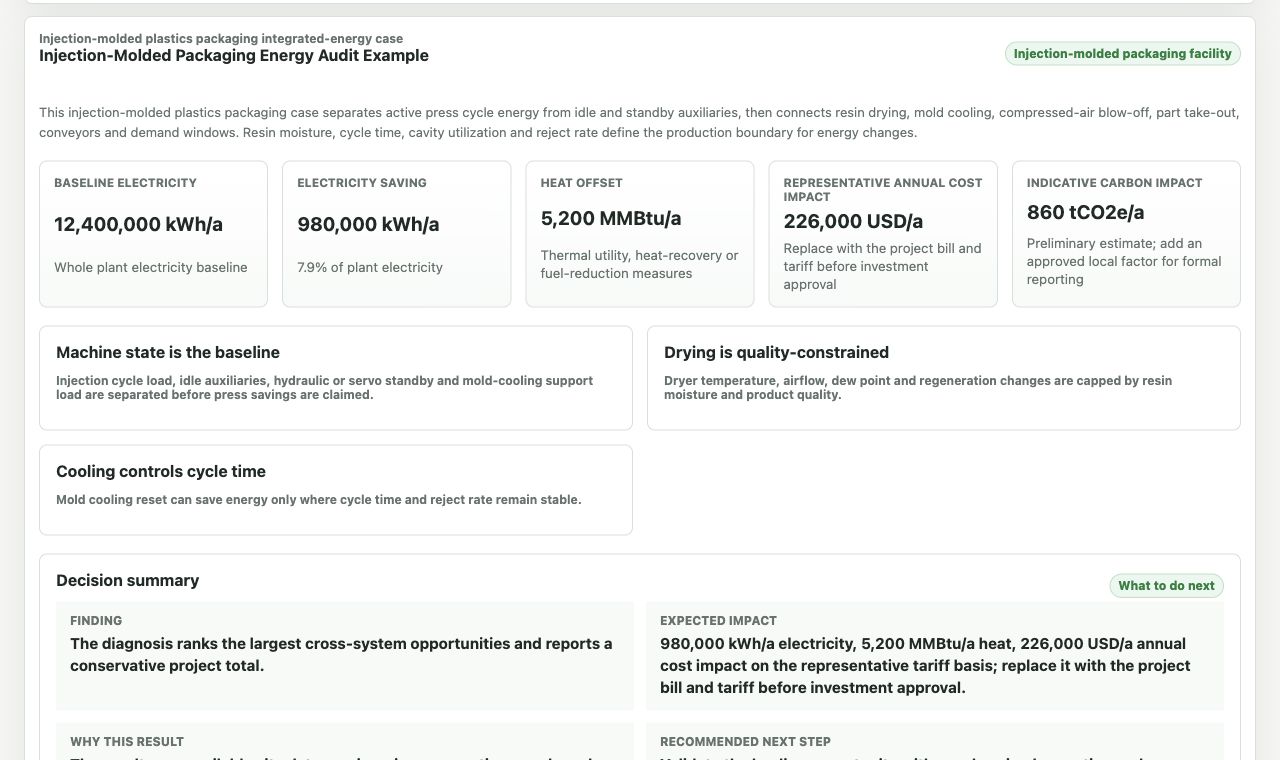
Actual diagnosis output
Machine load, resin drying, cooling and compressed air in one project result.
The report preserves material quality and mold-temperature constraints while ranking the leading actions.
Production boundary first
Plastics energy savings depend on machine state, drying quality and cooling temperature.
A packaging plant cannot be reviewed as only a compressed-air or chiller problem. Machines, dryers, cooling water, air pressure and demand peaks interact with product quality and production schedule.
Machine load, cycle time, drive type and standby hours define the main electricity baseline.
Mold/tool cooling temperature and flow affect chiller, tower and pump energy.
Pressure, leakage, blow-off and packaging users create compressor opportunities.
Compressor or dryer heat can offset useful heat only where a real heat sink exists.
Machines, dryers, chillers and compressors can create coincident peaks.
Diagnosis result structure
What the plastics workflow produces.
The report keeps production machine energy, resin drying, process cooling, compressed air and demand management in separate sections before showing the project view.
Measure groupWhy it mattersEnergy boundaryData to improve confidence
Machine standby and drive control
Auxiliaries and idle machines can carry large base load.
Machine kWh reduction.
Machine status logs, power trend and shift schedule.
Resin dryer scheduling and dew-point control
Dryer operation must protect resin quality while avoiding idle heat.
Dryer heat/electricity.
Dryer temperature, dew point, airflow and material schedule.
Process cooling optimization
Cooling temperature and flow affect product quality and chiller energy.
Chiller, tower and pump electricity.
Supply/return temperature, flow, chiller kW and mold requirements.
Compressed-air pressure and leakage
Air misuse and high pressure increase compressor kWh.
Compressor electricity, separate from machine load.
Pressure trend, compressor power, dryer type and leak survey.
Demand coordination
Machines, dryers, chillers and compressors can overlap at the peak.
Demand charge separated from kWh savings.
Utility interval data and production schedule.
Evidence basis
Public references support the plastics energy boundary.
Supports pressure, leakage, controls and compressor-system review.
Open public referenceSupports process heating, drying and heat-recovery assessment logic.
Open public referenceThe workflow is designed for machine, dryer, cooling, compressed-air and interval power data.
Quantification package
What must be measured before this becomes a decision-ready plastics report.
The report quantifies machine, dryer, cooling, compressed-air and demand opportunities only after production state and quality constraints are tied to utility data.
Calculation layerRequired site dataMethod outputConfidence and M&V
Machine and production baseline
Machine list, rated power, cycle time, production schedule, standby hours, material family and interval power trend.
Machine kWh baseline and standby-loss estimate by line or process family.
Screening with nameplate and schedule; measured result with machine-status and power trend.
Drying, cooling and compressed air
Dryer temperature/dew point, cooling supply/return, chiller kW, air pressure, compressor kW and blow-off/leak observations.
Dryer heat/electricity, process cooling kWh and compressor kWh separated by utility boundary.
M&V uses dryer trend, cooling-water trend, pressure trend and compressor meter data.
Overlap control
Fan/pump heat, cooling load, dryer scheduling and recovered heat assigned to the owning measure.
Demand charge is shown separately from physical kWh savings.
Quality records and scrap/reject trend are required before changing drying or mold-cooling targets.
Reference-backed method
Public method references behind this injection-molded packaging case.
These references are used as method context for audit structure, system boundaries, evidence quality and M&V planning. They do not confirm site savings; the workflow still requires site data before investment use.
Reference familyHow it supports this case
ISO 50002 / ISO 50001
Audit boundary, evidence quality, method basis and report output.
DOE process-heating guidance
Resin drying, desiccant regeneration and useful heat-recovery screening.
DOE compressed-air / motor / pump / fan guidance
Blow-off, leakage, pumps, conveyors, drives and demand-side support loads.
Before running the workflow
What an injection-molded packaging user can judge before running the workflow.
This page shows the industry-specific signals used in the detailed diagnosis report, so a visitor can judge relevance before entering site data.
Visible signalWhat it tells the user
Process signal
Injection molding presses, resin drying, mold cooling and part take-out are treated as the main production profile.
Energy signal
Press state, resin drying, mold cooling and compressed-air blow-off have separate owners.
Boundary signal
Resin moisture, dryer dew point, mold temperature, cycle time, cavity utilization and reject rate gate savings.
Use this injection-molded packaging case as a production-energy pre-audit.
Start from the injection-molded packaging workflow, then replace the sample method inputs with press, dryer, mold-cooling and compressed-air data from your site. Use the example diagnosis to inspect the method, or start a clean diagnosis with your own facility data.