Patient areas, procedure rooms, clinical support zones and public areas drive schedules.
Hospital campus central plant audit example
Chillers, boilers, ventilation, domestic hot water and terminal HVAC diagnosed as one 24/7 service system.
This case starts from occupancy and service reliability, then maps chilled water, boilers, heat pumps, DHW, terminal reheat, ventilation and demand charge.
- Separates cooling, heating, DHW, ventilation and terminal loads.
- Flags simultaneous heating/cooling and low delta-T as system issues.
- Reports heat recovery and heat pumps as substitution measures, not free savings.
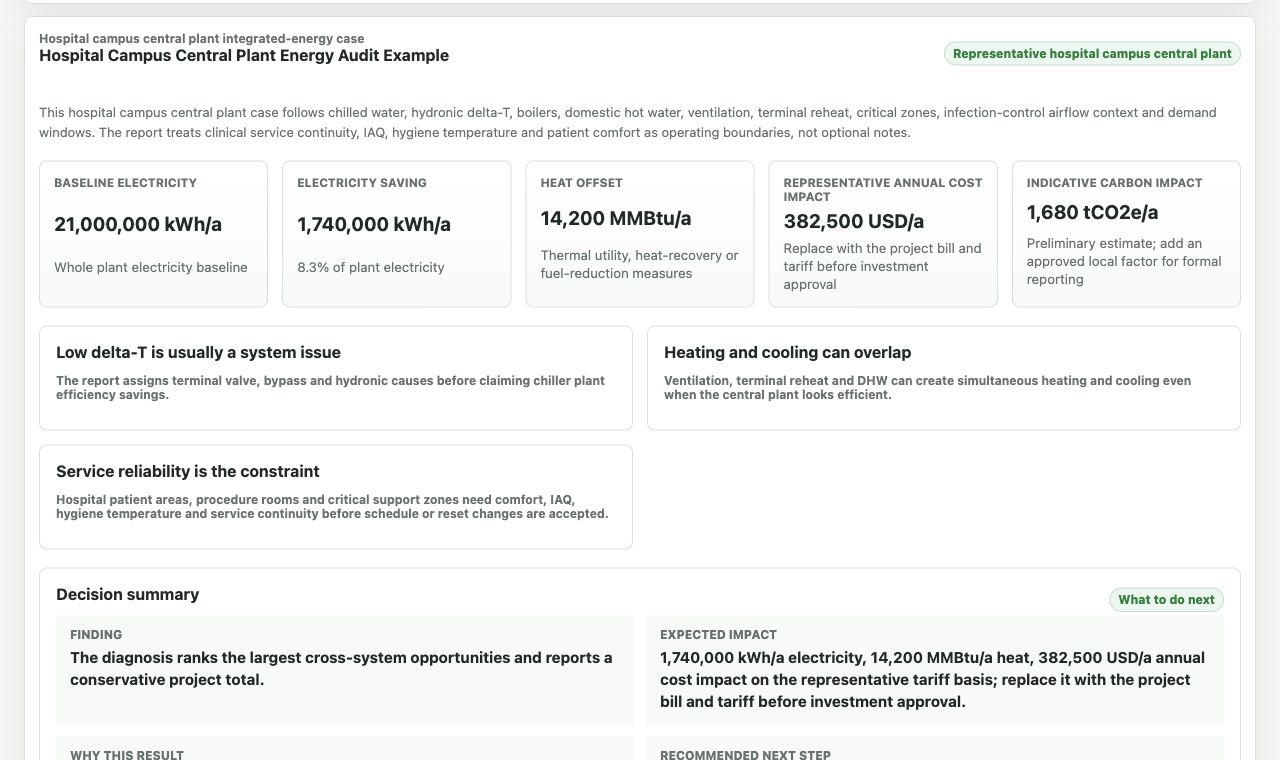
Actual diagnosis output
Cooling, heating, DHW and ventilation ranked inside a 24/7 reliability boundary.
The result separates physical savings, thermal offsets and the evidence needed before implementation.
Service boundary first
Central plant savings depend on who is served, when, and with what reliability.
A hospital campus plant must keep patient comfort, hygiene hot water, critical zones and ventilation available. The report therefore separates load reduction, plant efficiency and heat-recovery substitution.
Chiller sequencing, chilled-water reset, condenser control and delta-T define cooling efficiency.
DHW, heating and reheat loads create fuel demand and heat-recovery targets.
Outdoor air, fan static pressure and reheat can dominate variable operation.
Recovered heat can offset boiler energy only where a real heat sink exists.
Peak electricity and 24/7 reliability define implementation limits.
Diagnosis result structure
What the central plant workflow produces.
The report shows cooling, heating, DHW, ventilation, terminal HVAC and heat-recovery sections with action priority and M&V data.
Measure groupWhy it mattersEnergy boundaryData to improve confidence
Chiller sequencing and reset
Plant operation and low delta-T affect cooling electricity.
Chiller, pump and tower kWh.
Ton-hours, plant kW, flow and temperatures.
Boiler and DHW review
DHW and reheat can carry constant fuel load.
Fuel or steam reduction.
Boiler trend, DHW volume, return temperature and schedule.
Ventilation schedule and static pressure
Fan and conditioning energy depend on air volume and hours.
Fan kWh plus cooling/heating interaction.
AHU schedule, airflow, static pressure and IAQ limits.
Heat recovery or heat pump screen
Recovered heat is useful only when sink timing and temperature match.
Fuel offset, possible electric increase shown separately.
Heat-source trend, DHW/reheat demand and tariff.
Quantification package
What must be measured before this becomes a decision-ready central plant report.
The report quantifies cooling, heating, DHW, ventilation and terminal HVAC only after service reliability and occupancy schedules are tied to plant trend data.
Calculation layerRequired site dataMethod outputConfidence and M&V
Cooling and heating baseline
Chilled-water ton-hours, plant kW, boiler fuel, DHW load, return temperatures and occupancy schedule.
Chiller kW/ton, boiler fuel intensity, DHW/reheat baseline and service-load split.
Measured result with BAS trend and utility meters; screening estimate with bills and operating hours.
Ventilation and terminal operation
AHU schedules, airflow, static pressure, terminal reheat, CO2/IAQ limits and zone service requirements.
Fan kWh, conditioning load and simultaneous heating/cooling opportunity.
M&V uses BAS trend, comfort/IAQ records and plant-meter normalization.
Overlap control
Chiller reset, ventilation schedule, reheat and heat recovery assigned before totals.
Recovered heat and heat-pump substitution are shown as fuel offset with possible electric impact.
Service reliability remains a report constraint, not an optional note.
Reference-backed method
Public method references behind this central plant case.
These references are used as method context for audit structure, system boundaries, evidence quality and M&V planning. They do not confirm site savings; the workflow still requires site data before investment use.
Reference familyHow it supports this case
ISO 50002 / ISO 50001
Audit boundary, energy baseline and M&V structure.
ASHRAE HVAC practice context
Chiller plant, ventilation, terminal reheat, comfort and IAQ boundaries.
DOE steam and process-heating sourcebooks
Boiler, DHW, condensate, heat-recovery and distribution-loss screening.
Before running the workflow
What a 24/7 service plant user can judge before running the workflow.
This page shows the industry-specific signals used in the detailed diagnosis report, so a visitor can judge relevance before entering site data.
Visible signalWhat it tells the user
Process signal
The modeled case is a 24/7 hospital campus central plant profile with critical zones and hygiene hot-water boundaries.
Energy signal
Low delta-T, terminal reheat, DHW and ventilation are assigned before plant-only savings.
Boundary signal
Critical zones, DHW hygiene temperature, comfort and IAQ records gate the measures.
Use this hospital central plant case as a service-reliability pre-audit.
Start with utility bills, plant trend, critical-zone list and clinical schedule, then refine the report with BAS data. Use the example diagnosis to inspect the method, or start a clean diagnosis with your own facility data.