Machine count, spindle hours and idle state define the electricity baseline.
Automotive parts machining integrated-energy audit example
CNC standby, compressed air, coolant cooling, washing heat and demand peaks diagnosed as one machining utility system.
This case maps CNC cells, fixtures, blow-off, coolant loops, washers, ventilation and electrical demand into a pre-audit report boundary.
- Separates machine standby, compressed air, cooling, washer heat and ventilation.
- Flags blow-off misuse and compressed-air pressure as separate from CNC load.
- Reports demand-charge impact separately from physical kWh savings.
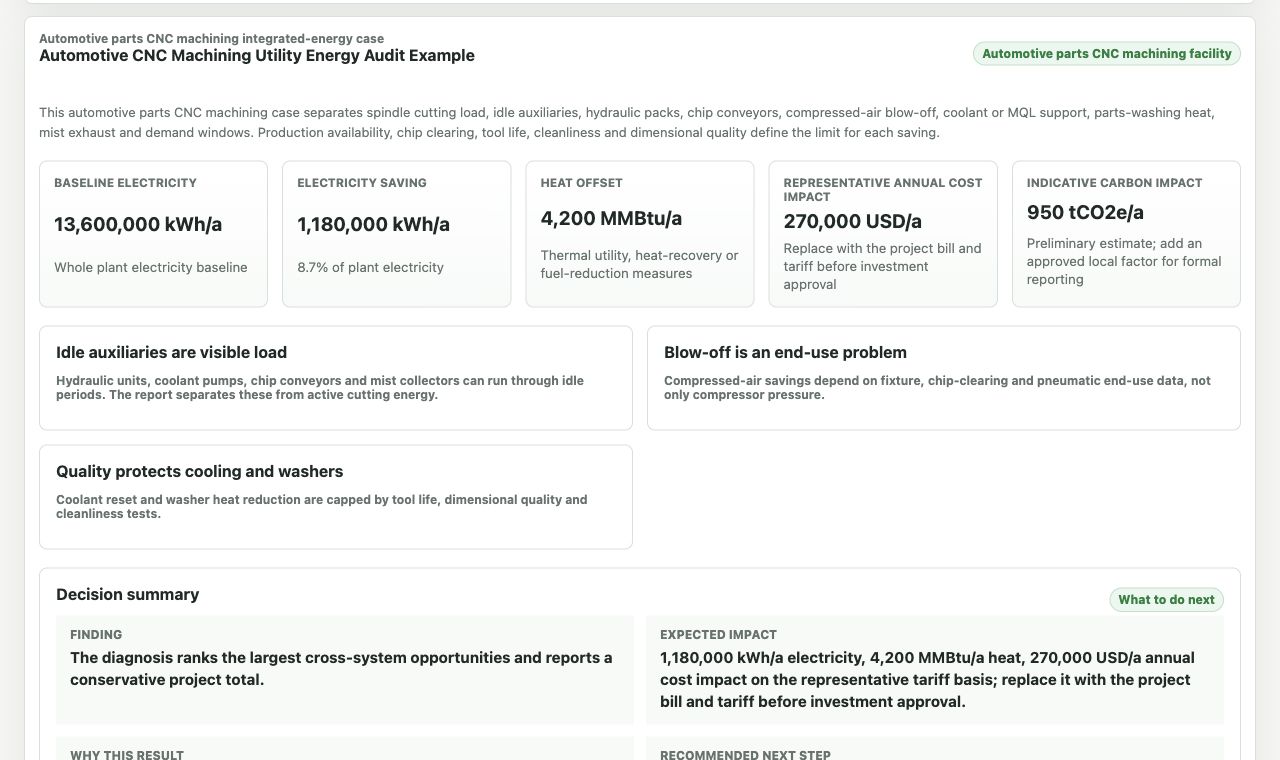
Actual diagnosis output
CNC standby, air, cooling and washer heat ranked in one facility result.
The report separates physical kWh savings from demand-charge impact and production constraints.
Machine state first
Machining energy is often lost outside the cutting cycle.
The report separates spindle production, auxiliary standby, compressed air, coolant, washers and ventilation so utility measures do not get mixed with production changes.
Fixtures, tools and blow-off create pressure and leakage opportunities.
Coolant temperature and pumping affect quality and electricity.
Hot-water or heated washer loads create a thermal utility boundary.
Exhaust and comfort airflow are reviewed by schedule and requirement.
Compressors, machines, washers and chillers may align at the peak.
Diagnosis result structure
What the machining workflow produces.
The report shows machine standby, compressed air, cooling, washing heat, ventilation and demand opportunities with data confidence labels.
Measure groupWhy it mattersEnergy boundaryData to improve confidence
Machine standby and auxiliary shutdown
Idle auxiliaries can create a large base load.
Machine kWh.
Machine status logs and interval power.
Compressed-air pressure, leaks and blow-off
Air is often used for convenience where lower-energy methods fit.
Compressor kWh.
Pressure trend, compressor power and leak survey.
Coolant pumping and cooling
Coolant temperature and flow must protect machining quality.
Pump/chiller kWh.
Coolant temperature, flow, pump power and production state.
Washer heat and ventilation
Washing and exhaust loads create thermal and fan opportunities.
Fuel/electric heat and fan kWh.
Washer temperature, operating hours and ventilation schedule.
Quantification package
What must be measured before this becomes a decision-ready machining report.
The report quantifies CNC standby, compressed air, coolant cooling, washing heat, ventilation and demand only after machine state and production schedule are tied to utility data.
Calculation layerRequired site dataMethod outputConfidence and M&V
CNC and auxiliary baseline
CNC count, spindle hours, idle hours, machine power trend, washer schedule, coolant temperature and production calendar.
Machine standby kWh, washer heat demand and coolant-cooling boundary.
Measured result with machine status and interval power; screening estimate with counts and shift schedule.
Compressed air and ventilation
Air pressure, compressor kW, blow-off users, leakage survey, mist exhaust and ventilation schedule.
Compressor kWh, blow-off reduction, leak recovery and fan schedule opportunity.
M&V uses pressure trend, compressor meter, leak survey and ventilation status trend.
Overlap control
Machine standby, compressed air, cooling and demand measures assigned to separate load owners.
Demand charge is reported separately from physical kWh reduction.
Part quality, coolant requirements and production availability define implementation limits.
Reference-backed method
Public method references behind this automotive machining case.
These references are used as method context for audit structure, system boundaries, evidence quality and M&V planning. They do not confirm site savings; the workflow still requires site data before investment use.
Reference familyHow it supports this case
ISO 50002 / ISO 50001
Audit boundary, data quality, evidence labels and report output.
DOE compressed-air guidance
Blow-off, leakage, pressure and end-use review in machining cells.
DOE motor, pump, fan and process-heating context
Machine auxiliaries, coolant pumps, mist exhaust, washer heat and demand control.
Before running the workflow
What a machining user can judge before running the workflow.
This page shows the industry-specific signals used in the detailed diagnosis report, so a visitor can judge relevance before entering site data.
Visible signalWhat it tells the user
Process signal
Hydraulic units, chip conveyors, coolant/MQL mode and spindle state are visible in the boundary.
Energy signal
CNC standby, compressed air, coolant cooling, washers and mist exhaust have separate owners.
Boundary signal
Tool life, chip clearing, cleanliness and dimensional quality gate savings.
Use this machining case as a utility and standby-loss screen.
Start with machine hours, compressed-air data, coolant trend, washer heat and interval power. Use the example diagnosis to inspect the method, or start a clean diagnosis with your own facility data.